To inform broadband policy and planning, the Department annually surveys and maps the deployment of high-speed broadband internet access in Vermont, pursuant to 30 V.S.A. § 202e (e). The Department prepares a map, narrative description, and cost estimate to provide broadband service at the following speeds: 4/1 - 4 Mbps download speed and an upload speed of at least 1 Mbps; 25/3 - at least 25 Mbps download speed and an upload speed of at least 3 Mbps; and 100/100 - download speed of at least 100 Mbps and is symmetrical. If monetarily feasible, the Department also maps areas served and the areas not served by wireless communications service.
2024 Data
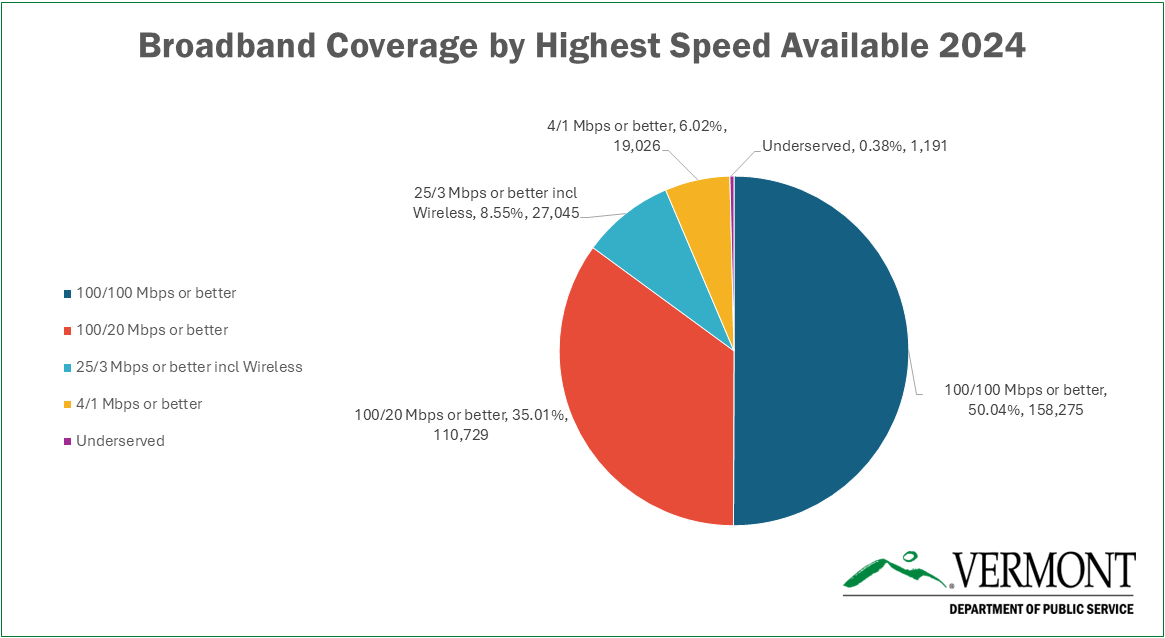
Each tier shows the quantity of locations served at that speed or better for 2024. The address level information can be viewed on an interactive map. Statistics include a breakdown by town and county can be downloaded here. The Detail tab lists the breakdown by town for the quantity of locations in each specific tier.
The interactive maps, statistic breakdowns, and Speed Tier maps are in production and will be posted once available.
| Speed Tier | Served | Percent | Not Served | Percent |
| 100/100 Mbps | 158,275 | 50.04% | 157,991 |
49.96% |
| 100/20 Mbps | 269,004 | 85.06% | 47,262 | 14.94% |
| 25/3 Mbps | 296,049 | 93.61% | 20,217 | 6.39% |
| 4/1 Mbps | 315,075 | 99.62% | 1,191 | 0.38% |
Broadband Maps by Speed Tiers
The locations depicted on the following Broadband Speed Tiers Map indicate where all speeds are available and not available as voluntarily reported by Vermont's Broadband providers. The speeds represented in this map are as followed, served at 100/100 or greater, 100/20 or greater, 25/3 or greater, 4/1 or greater, and underserved. Please use the legend to separate the speed tiers layers. Only one speed is visible at a time.
Broadband Speed Tiers by E911 Address
2023 Data
Each tier shows the quantity of locations served at that speed or better. The address level information can viewed on an interactive map. Statistics include a breakdown by town and county can be downloaded here. The Detail tab lists the breakdown by town for the quantity of locations in each specific tier.
| Speed Tier | Served | Percent | Not Served | Percent |
| 100/100 Mbps | 125,686 | 39.87% | 189,506 |
60.13% |
| 100/20 Mbps | 256,668 | 81.43% | 58,524 | 18.57% |
| 25/3 Mbps | 287,758 | 91.30% | 27,407 | 8.70% |
| 4/1 Mbps | 313,435 | 99.44% | 1,757 | 0.56% |

Broadband Maps by speed tiers
Served 4/1 or greater and Underserved
The locations depicted on this map indicate where speeds of 4/1 or greater are available and not available as voluntarily reported by Vermont's Broadband providers.
Served 25/3 or Greater
The locations depicted on this map indicate where speeds of 25/3 or greater are available and not available as voluntarily reported by Vermont's Broadband providers.
Served 100/20 or Greater
The locations depicted on this map indicate where speeds of 100/20 or greater are available and not available as voluntarily reported by Vermont's Broadband providers.
Served 100/100 or Greater
The locations depicted on this map indicate where speeds of 100/100 or greater are available and not available as voluntarily reported by Vermont's Broadband providers.
2022 Data
The information in the reports, last updated with data from 11/8/2022, is summarized in the table below, for a total of 313,062 buildings. Each tier shows the quantity of locations served at that speed or better. The address level information can viewed on an interactive map. Statistics for 2022 include a breakdown by town and county can be downloaded here. The Detail tab lists the breakdown by town for the quantity of locations in each specific tier.
| Speed Tier | Served | Percent | Not Served | Percent |
| 100/100 Mbps | 108,086 | 34.5% | 204,976 | 65.5% |
| 100/20 Mbps | 246,494 | 78.7% | 66,568 | 21.3% |
| 25/3 Mbps | 254,903 | 81.4% | 58,159 | 18.6% |
| 25/3 Mbps W | 258,531 | 82.6% | 54,531 | 17.5% |
| 4/1 Mbps | 303,124 | 96.8% | 9,938 | 3.2% |
The "25/3 Mbps W" tier includes wireless broadband services, where speed tests were conducted within 500' of a location to demonstrate deployment.
The chart below depicts the breakdown by speed tier.

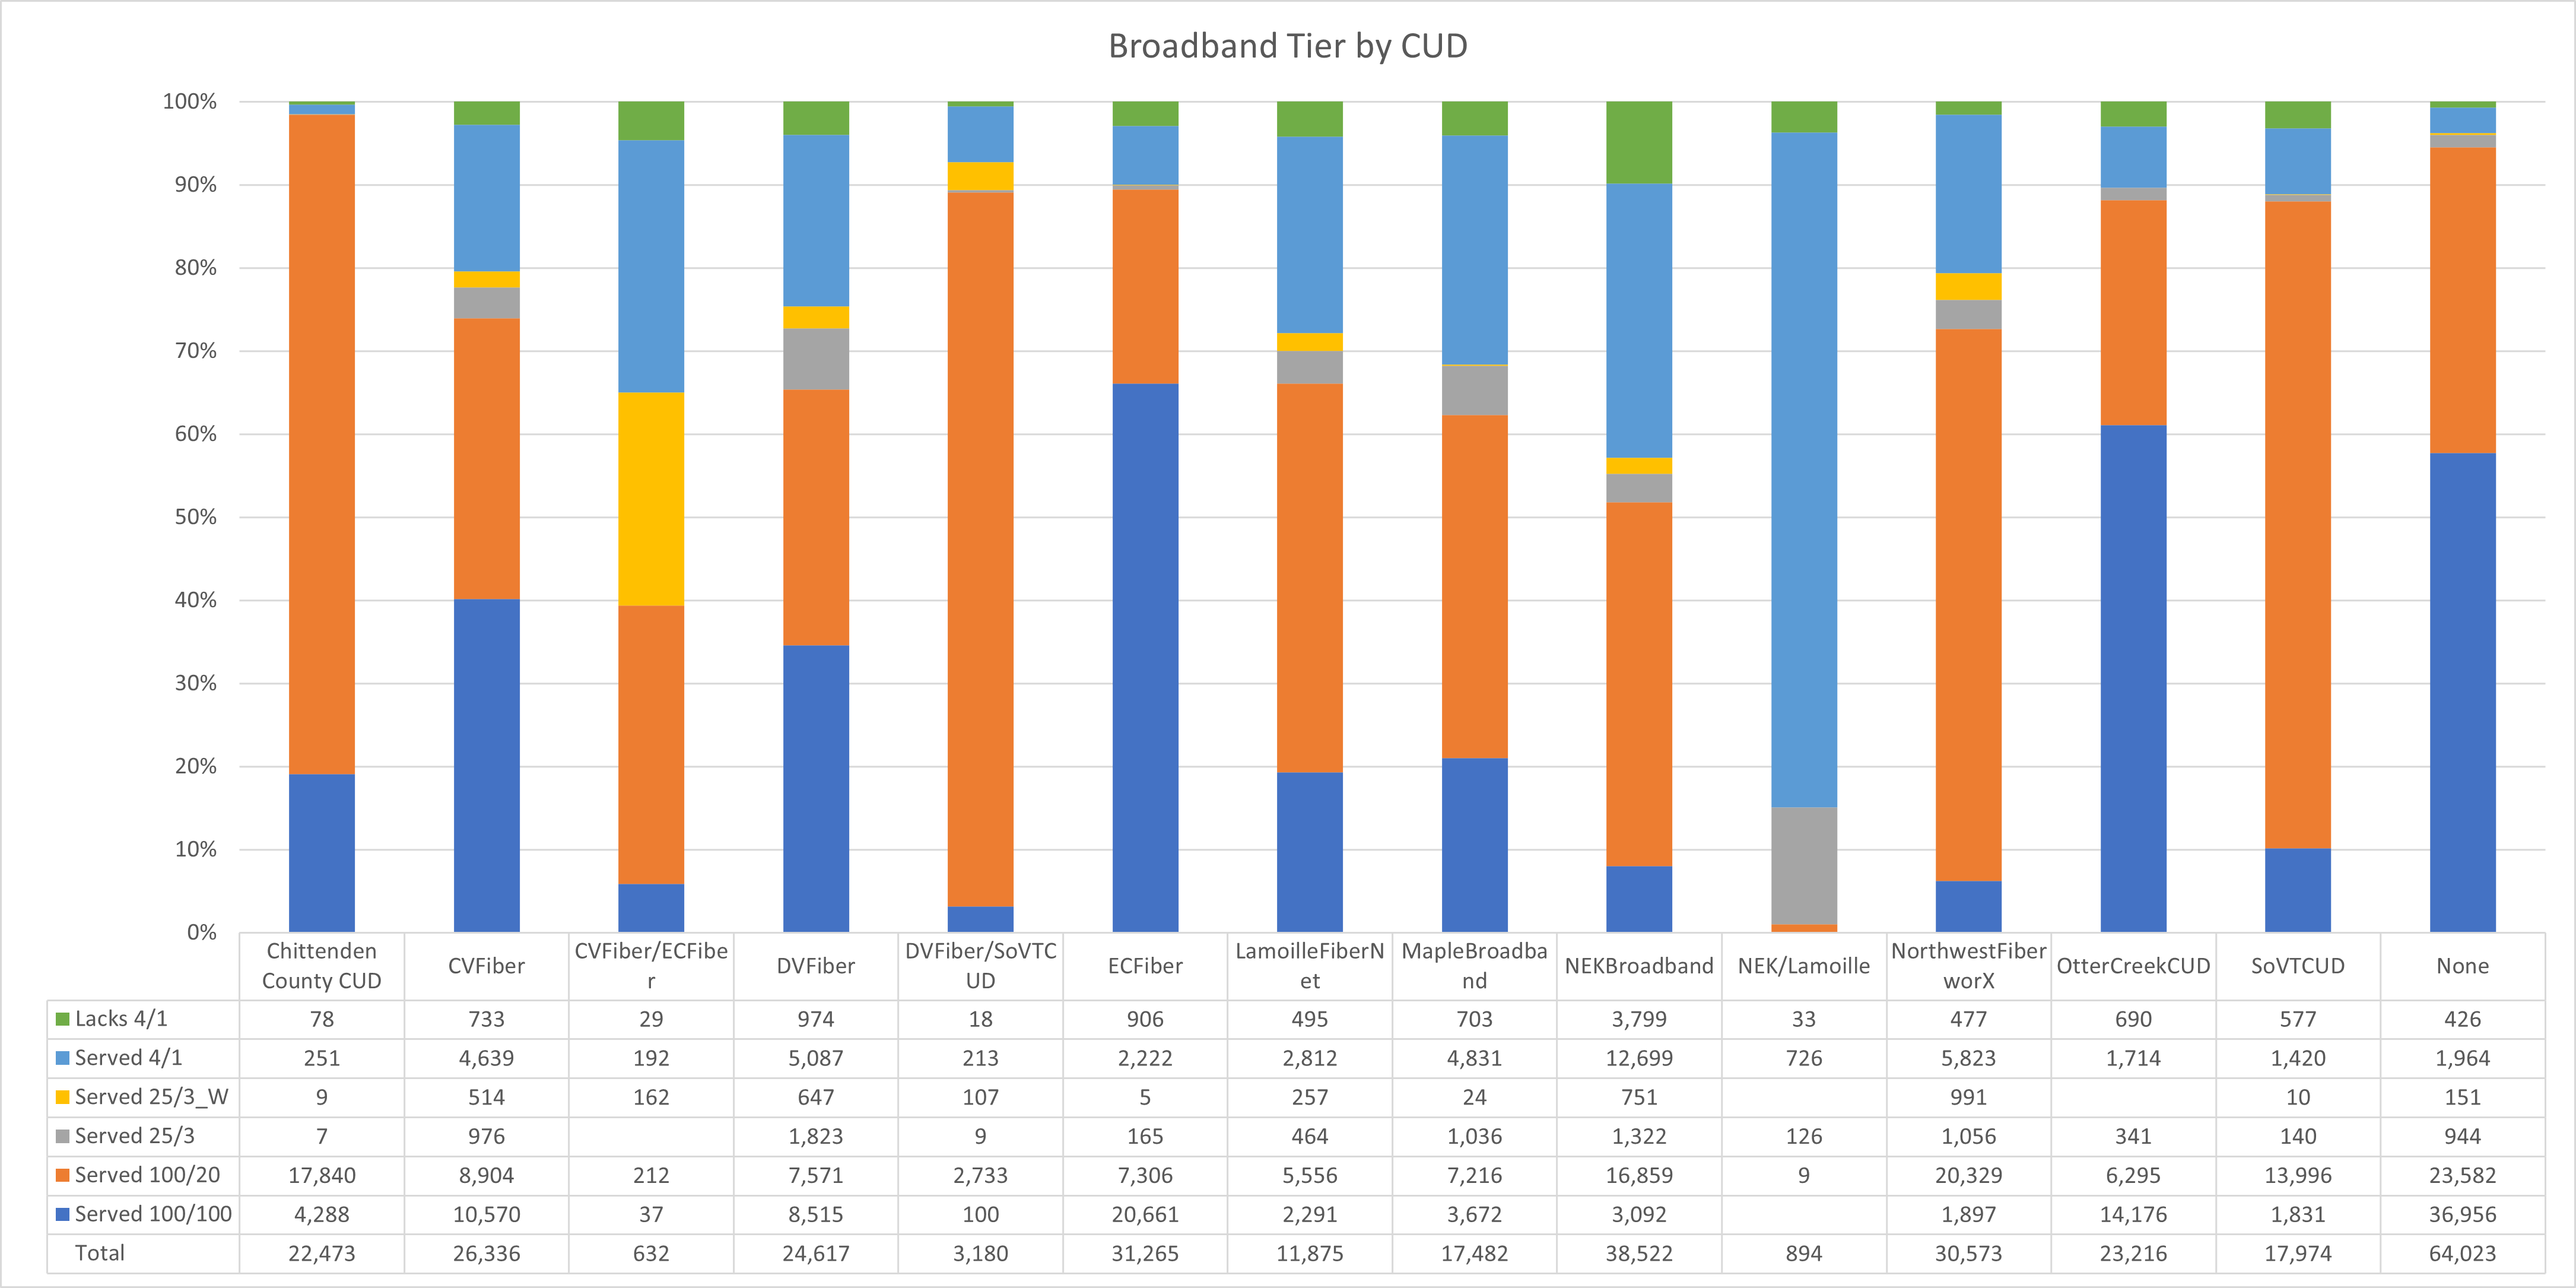
The chart below depicts the breakdown by CUD (Communications Union District) territory
Broadband Available by E911 Building Location 4 Mbps Down/1 Mbps Up or Better (PDF - 16 MB)
- 302,917 out of 313,062 E911 building locations (96.8%) statewide are served at 4/1 Mbps or better by independent telephone companies, cable, or fiber to the premises.
- 10,145 out of 313,062 E911 building locations (3.2%) statewide are served with broadband less than 4/1 Mbps. Of these locations, some number are already served at 4/1 or better but this cannot be verified
due to the inability of the companies to provide accurate data at this time.
Broadband Available by Road Segment 100 Mbps Down/20 Mbps Up or Better (PDF - 5 MB)
- Roads and addresses served at 100/20 Mbps or better by fiber to the home or cable. 245,680 out of 313,062 building locations (78.5%) are serviceable at 100/20 Mbps or better.
- Roads not served at 100/20 Mbps or better. 67,382 out of 313,062 building locations (21.5%) are serviceable with broadband less than 100/20 Mbps.
Broadband Available by Road Segment 100 Mbps Down/100 Mbps Up or Better (PDF - 4 MB)
- Roads are served at 100/100 Mbps or better by fiber to the premises. 94,790 out of 313,062 building locations (30.3%) are served at 100/100 Mbps or better by fiber to the premises.
- Roads not served at 100/100 Mbps or better. 218,272 out 313,062 building locations (69.7%) are served with broadband less than 100/100.
2022 ROUTE DATA
NOTE. On 12/2/2022 the PSD informed providers that it intended to revise this dataset to state that it is current as of 6/30/2022, and requested updates necessary to comply with this production date. Several updates were received and this dataset was updated on 2/23/2023.:This information is reflected in the interactive map and layers below, but not in the statistics.
2021 Data
The information reported 10/31/21 is summarized in the table below. Each tier shows the quantity of locations served at that speed or better. The address level information can veiwed on an interactive map.
| Speed Tier | Served | Not Served | ||
| 100/100 Mbps | 90,728 | 29.2% | 219,905 | 70.8% |
| 100/20 Mbps | 236,338 | 76.1% | 74,295 | 23.9% |
| 25/3 Mbps | 249,439 | 80.3% | 61,194 | 19.7% |
| 4/1 Mbps | 298,719 | 96.2% | 11,914 | 3.8% |
Broadband Deployment by speed. This chart shows the quantity of locations in each specific speed tier.
Broadband Statistics
Statistics, last updated 10/31/21, include a breakdown by town and county can be downloaded in Excel. The Detail tab lists the breakdown by town for the quantity of locations in each specific tier.
Analysis Presentation
PSD staff prepared a presentation relating analysis of the 2021 broadband deployment data for a VCBB meeting 11/15/21.
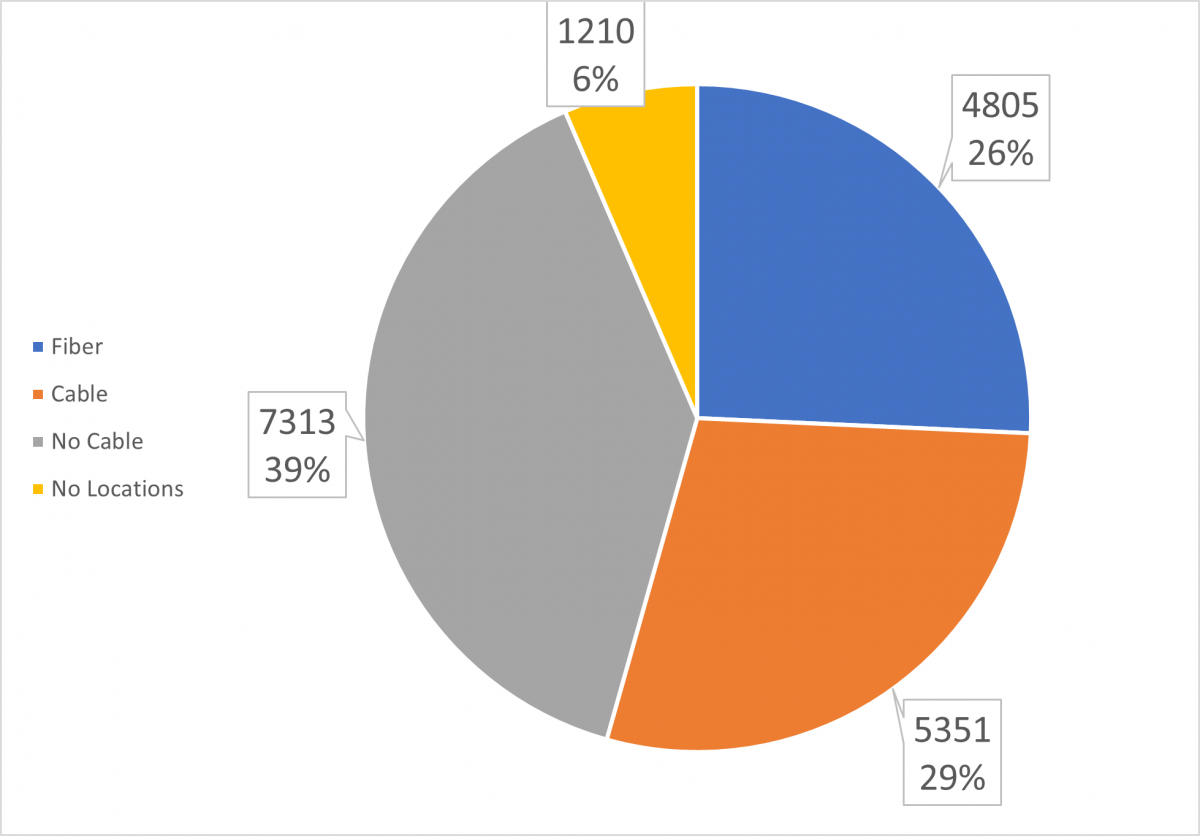
Road mile analysis
The PSD conducted an analysis 18,679 road miles in Vermont and classified all road segments by deployment of route-based broadband services, (cable or FTTH). For this analysis we started with roads reported as served by FTTH. Many of these roads may also be served by cable. We next identified roads that are served by cable but that are not served by FTTH. Finally from the roads lacking both fiber and cable, we identified road segments that had not associated building driveways. The analysis results provide more information.
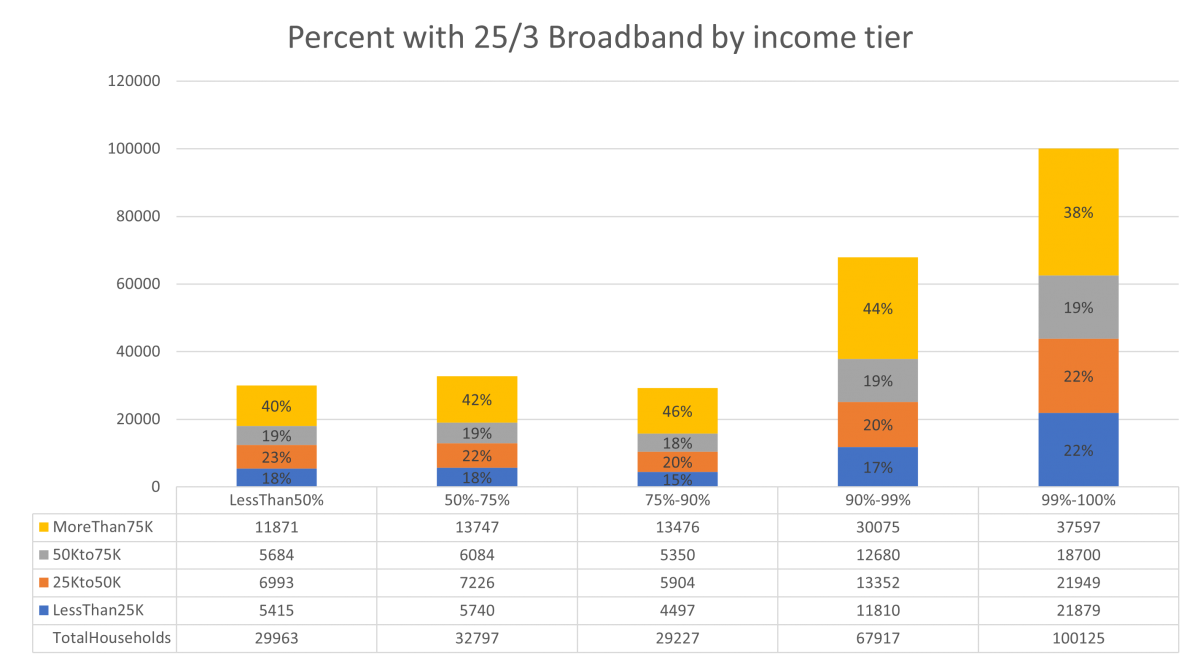
Income analysis
The PSD conducted an analysis of broadband deployment and household income. The data indicate that 68% of households that earn less than $25K/yr have access to 25/3 Mbps broadband service. It also indicates that 41% of households in areas with less than 75% deployment of 25/3 Mbps broadband service earn less than $50K/year. This analysis was conducted using the PSD 2021 broadband data, and 2019 estimated household income data from the US Census. The analysis was conducted on a census block group basis, but for large census block groups household income data on a town basis was used instead. The results are related in a presentation and supporting data in Excel, which includes a breakdown by CUD territory. The chart below depicts the distribution of households according to income tier and the percentage of locations in the Census Block Group that have access to broadband service at 25/3 Mbps.
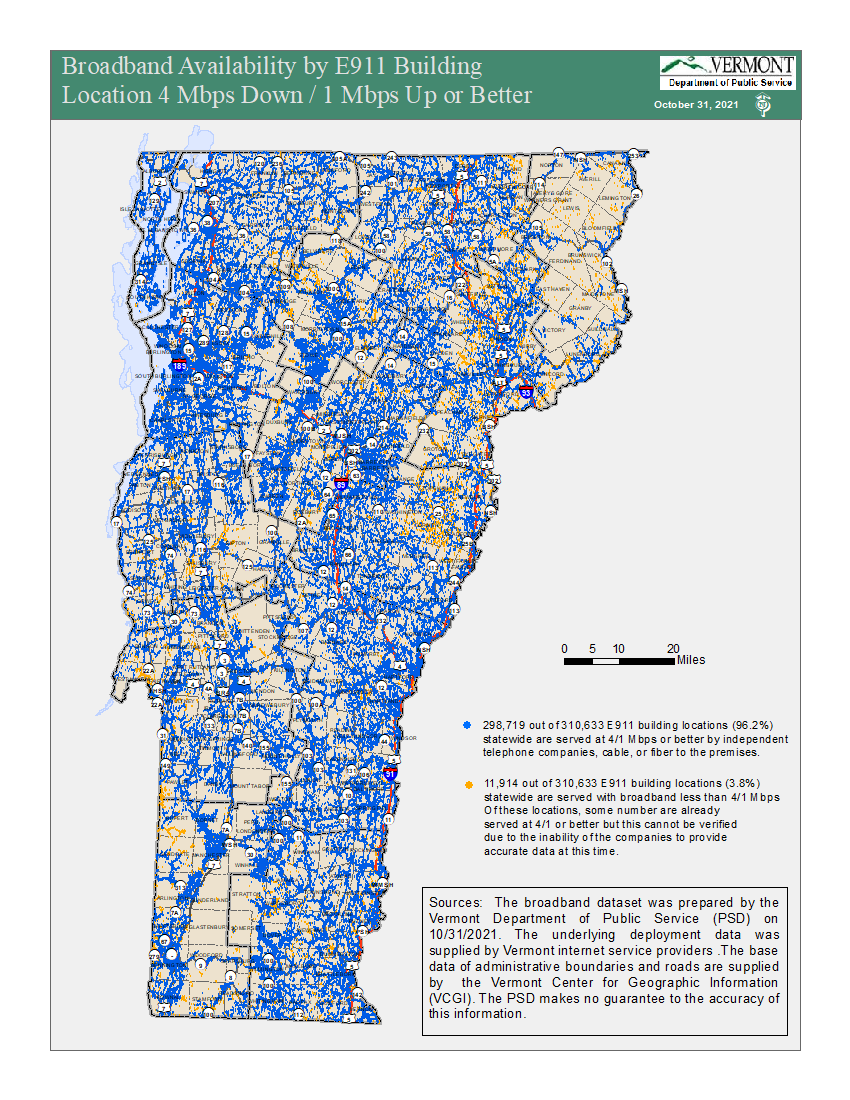
 Broadband Available by E911 Building Location 4 Mbps Down/1 Mbps Up or Better (PDF - 16 MB)
- 298,719 out of 310,633 E911 building locations (96.2%) statewide are served at 4/1 Mbps or better by independent telephone companies, cable, or fiber to the premises.
- 11,914 out of 310,633 E911 building locations (3.8%) statewide are served with broadband less than 4/1 Mbps Of these locations, some number are already served at 4/1 or better but this cannot be verified due to the inability of the companies to provide accurate data at this time.
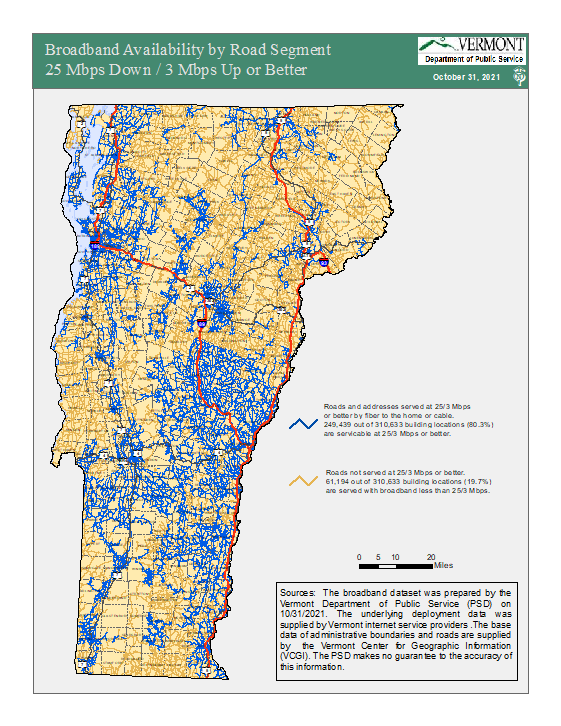
Broadband Available by Road Segment 25 Mbps Down/3 Mbps Up or Better (PDF - 5 MB)
- Roads and addresses served at 25/3 Mbps or better by fiber to the premises or cable. 249,439 out of 310,363 building locations (80.3%) are serviceable at 25/3 Mbps or better by fiber to the premises or cable.
- Roads not served at 25/3 Mbps or better. 61,194 out of 310,363 building locations (19.7%) are served with broadband less than 25/3
Broadband Available by Road Segment 100 Mbps Down/100 Mbps Up or Better (PDF - 4 MB)
- Roads are served at 100/100 Mbps or better by fiber to the premises or cable. 90,728 out of 310,633 building locations (29.2%) are served at 100/100 Mbps or better by fiber to the premises.
- Roads not served at 100/100 Mbps or better. 219,905 out 310,633 building locations (70.8%) are served with broadband less than 100/100.
Methodology
The broadband dataset was prepared by the Vermont Department of Public Service (PSD) on 10/30/21. The raw data was supplied by Vermont internet service providers based on an April 2021 request for information. The 25/3 Mbps data includes locations served by wireless service through Connectivity Initiative grants where deployment was demonstrated by speed tests. The 4/1 Mbps data includes locations reported as served by wireless service providers. The base data of administrative boundaries and roads are supplied by the Vermont Center for Geographic Information (VCGI). The PSD makes no guarantee to the accuracy of this information.
The information may be viewed on an interactive map on the PSD website. That page also has links to access the underlying data.
Prior Statistics
The table below relates the statistics for broadband deployment following the last analysis in 2019. The statistics by town can be downloaded.
| Speed Tier | Served | Not Served | ||
| 100/100 Mbps | 53,777 | 17.5% | 254,305 | 82.5% |
| 25/3 Mbps | 283,183 | 77.3% | 68,899 | 22.7% |
| 4/1 Mbps | 287,104 | 93.2% | 20,978 | 6.8% |